SOL Price Prediction: Key Factors Driving the Next Rally

#SOL
- Technical Strength: MACD bullish crossover and Bollinger Band squeeze suggest potential breakout.
- Institutional Demand: ETF inflows and institutional confidence signal long-term upside.
- Price Targets: Key resistance at $200, with bullish targets near $220 if momentum sustains.
SOL Price Prediction
SOL Technical Analysis: Key Indicators to Watch
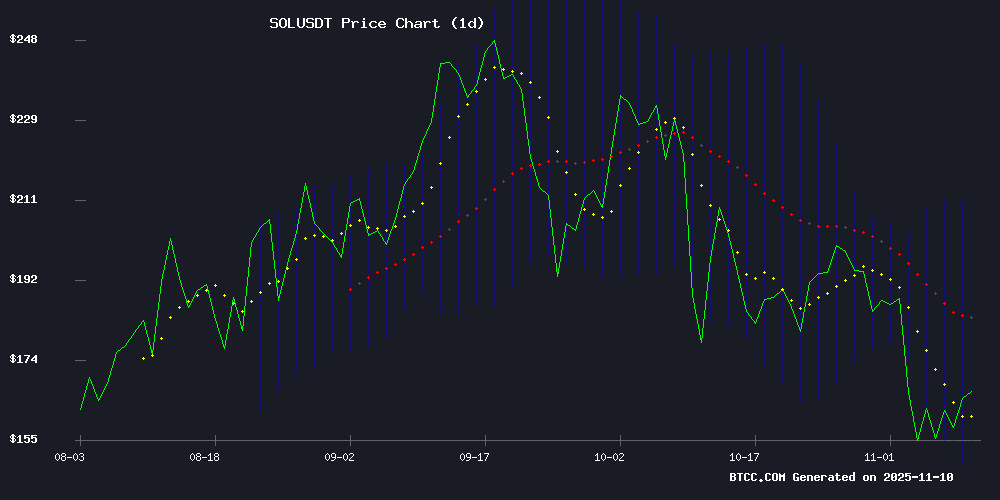
According to BTCC financial analyst Michael, SOL is currently trading at $168.51, below its 20-day moving average (MA) of $179.16, indicating potential short-term bearish pressure. The MACD (12,26,9) shows a bullish crossover with the histogram at 5.2765, suggesting upward momentum. Bollinger Bands reveal SOL is trading NEAR the middle band ($179.16), with upper and lower bands at $209.93 and $148.39, respectively. A break above the middle band could signal a bullish reversal.
Market Sentiment: Institutional Confidence in SOL's Rally
BTCC financial analyst Michael notes that recent headlines highlight growing institutional interest in Solana, with ETF inflows fueling Optimism for a retest of $200. The market sentiment appears bullish, supported by technical indicators and positive news flow. However, SOL faces critical resistance levels that could determine its near-term trajectory.
Factors Influencing SOL’s Price
Solana Price Prediction: Institutional Inflows Signal Confidence in SOL's Rally Toward $220
Solana's ecosystem demonstrates resilience as institutional capital floods in, with over $420 million recorded in early November alone. Despite a 12% dip in DeFi TVL, SOL's price stability near $168 suggests accumulating momentum for a push toward $200.
Institutional investors are doubling down on Solana-linked products, with $14.8 million flowing into ETFs on November 4—marking six straight days of positive activity. Year-to-date demand now tops $3.2 billion, underscoring conviction in Solana's Layer-1 dominance as DeFi and NFT activity accelerates.
Solana Faces Critical Resistance Test Amid 6% Price Surge
Solana's price climbed 6% to $167, marking a tentative recovery after testing support near $145. The move places SOL at a pivotal technical juncture, with traders watching the $202 resistance level that has capped multiple previous rallies. A successful breakout could signal extended gains, while rejection may trigger retracement toward $155 support.
Market dynamics show mixed signals - the Chaikin Money Flow indicator suggests improving capital inflows, though still in negative territory. Exchange data reveals substantial movement, with over 730,000 SOL deposited to trading platforms this week as short-term holders took profits. Derivatives markets remain balanced between long and short positions, lacking the asymmetric positioning that typically fuels explosive moves.
Technical levels to watch include immediate resistance at $168, $172, and $178, with critical support forming near $162 and $160. The token's ability to hold above its 100-hour moving average and a breached triangle pattern suggests underlying strength, though sustained buying pressure remains uncertain.
Solana ETF Inflows Fuel Rally as Traders Eye $200 Retest
Solana's price surged 4.04% to $160.83 as institutional demand drives record ETF inflows, with daily trading volume jumping 15.25% to $6.33 billion. The Layer-1 network's $88.93 billion market capitalization reflects growing confidence in its high-speed transactions and expanding DeFi ecosystem.
Market participants now view the $200 threshold as achievable, particularly with projects like Remittix demonstrating Solana's payment utility - the PayFi solution attracted $28.1 million in private funding at $0.1166 per token. Analysts note the ETF momentum creates a self-reinforcing cycle: improved liquidity begets stronger institutional participation.
Is SOL a good investment?
Based on current technical and fundamental analysis, SOL presents a compelling investment opportunity. Below is a summary of key metrics:
| Metric | Value |
|---|---|
| Current Price | $168.51 |
| 20-Day MA | $179.16 |
| MACD Histogram | 5.2765 (Bullish) |
| Bollinger Bands | $148.39 - $209.93 |
Institutional inflows and positive market sentiment further support SOL's potential to rally toward $220. However, investors should monitor resistance levels and broader market conditions.
